About The Program
Helix DeltaT Online Conveyor Design Software - Build and Analyze Belt Conveyors in your Web Browser
Build your conveyor
- Draw a sketch of the conveyor
-
-
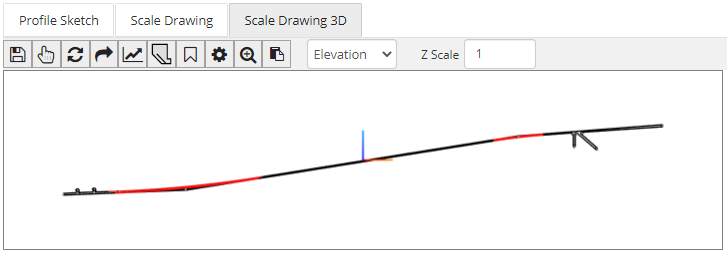
- Check the geometry in the Scale View
-
-
- Enter the data in the Input Tables - Coordinates, Pulley Dims, Sections, Brakes, Curves
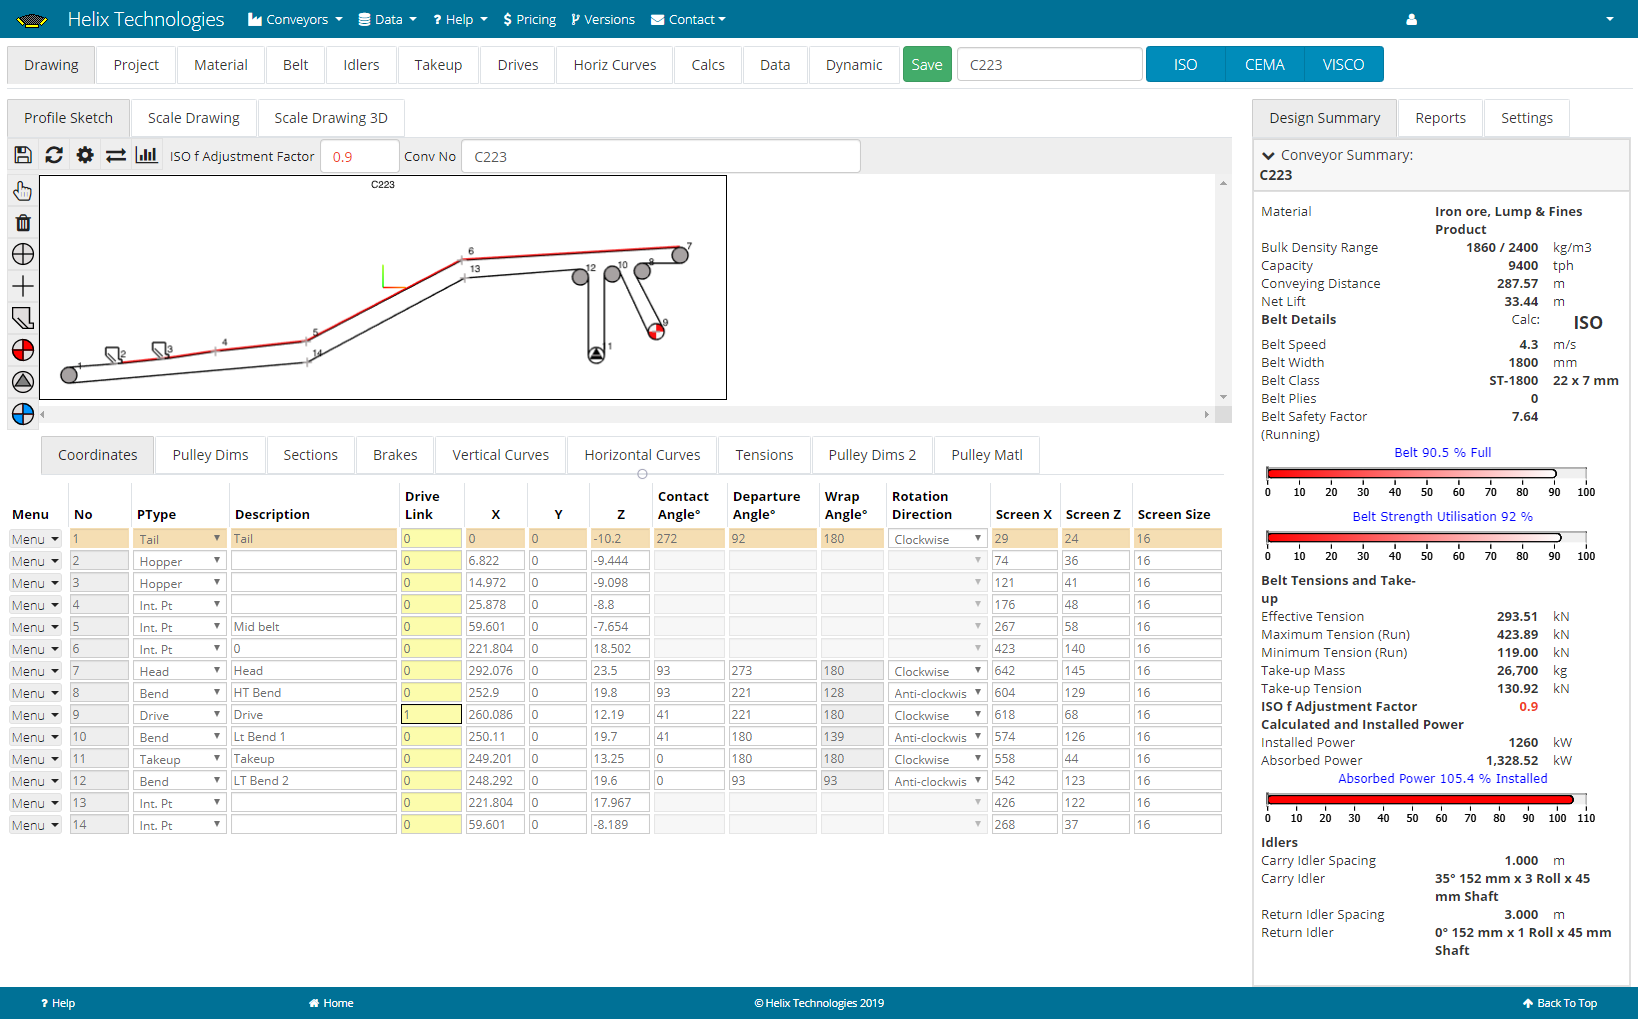
Go through the following tabs and enter the data or select the equipment from the databases
- Material
- Belt
- Idlers
- Takeup
- Drives
-
- Traction
- Motors
- Fluid Coupling
- GearBox
- High Speed Coupling
- Low Speed Coupling
- Brakes
- Holdback
- Horizontal Curves
Calculate
Use one of three calculation methods:
ISO - ISO 5048 is the International Standard method and is closely related to the German DIN 22101 Standard. The Helix DeltaT program follows the requirements of this standard with the addition of an automatic friction factor estimation based on belt sag. This f factor estimation has been successfully used to design and build many thousands of conveyors.
CEMA - (Conveyor Equipment Manufacturers Association) method uses the methods and formulae detailed in the CEMA manual v5.
VISCO - Short for Viscoelastic, this uses the conveyor belt Rubber properties to calculate the belt - roller indentation and combines this with the material and belt flexure losses and idler drag and scuffing resistance to accurately calculate the friction factor of the conveyor. This method is a very accurate method of calculating conveyors as it takes into account the actual rubber properties of the belt to calculate the friction factor. This method allows the user to design conveyors which utilize the latest technology including the Low Resistance Rubber belts made by leading manufacturers around the world.
Perform a Static Analysis calculation by pressing one of the calculate buttons.

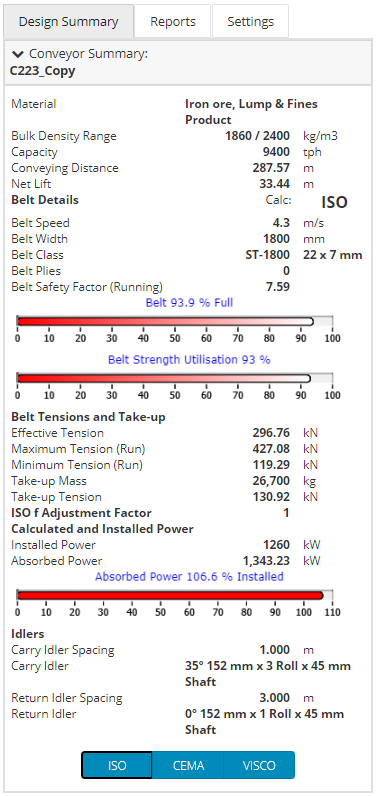
Review
After performing a Static Analysis Calculation review your Conveyor.
Design Summary
Review calculated belt details, Belt tensions and demand power.
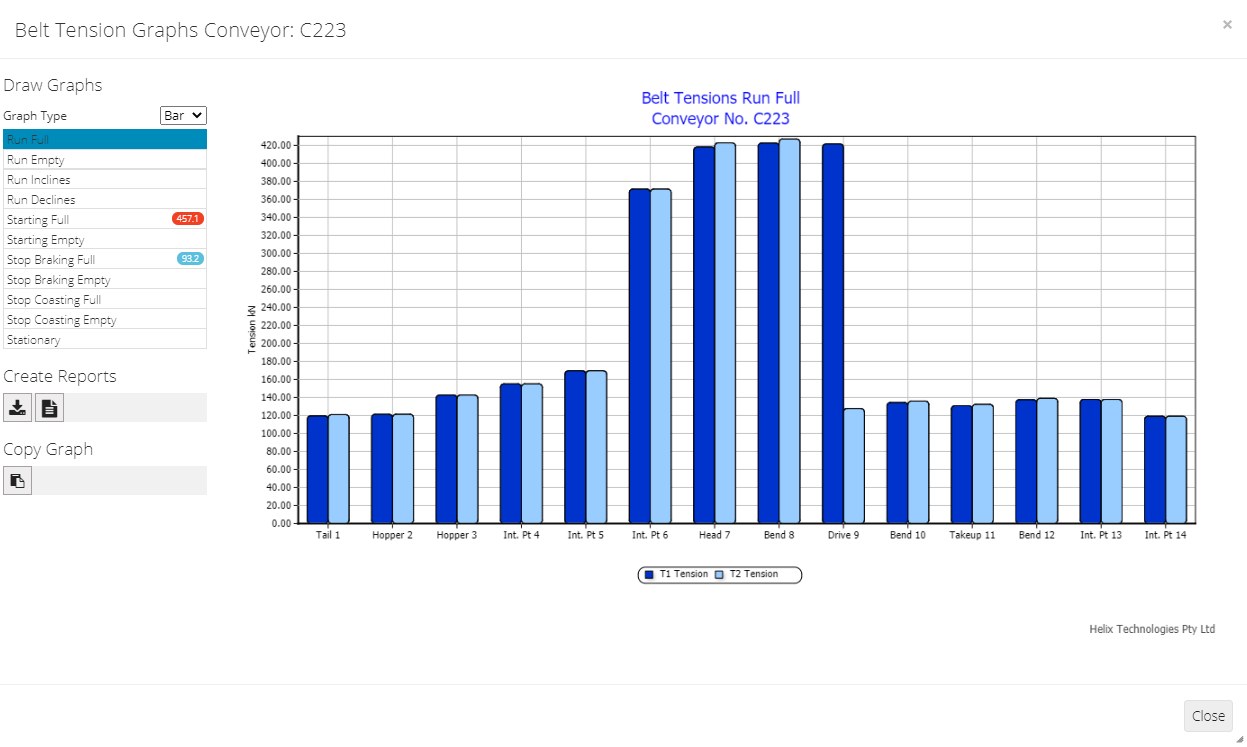
View Belt Tension Graph
Graph of the belt tension at each point along the conveyor under different running and loading conditions.
Create Reports
Print reports to see the following Information:
| Group | Report Name | Example Report Download (pdf) | Help Page | What is in the report? |
|---|---|---|---|---|
| Design | Design Summary | Download Report | Help Page | Summary of general Input data and calculated running belt tensions, Motor power demand under different scenarios, belt information like belt capacity and starting and stopping times etc. |
| General | Take-up and Drive Traction Report | Download Report | Help Page | Pulley Drive and Brake traction calculation results under different loading conditions to determine if belt slip will be present. |
| Belt Details Report | Download Report | Help Page |
Shows sketch of the cross-section of the load on the belt for both
the high and low bulk density cases.
Contains belt rated and calculated tensions, belt capacities and the flooded belt load area and masses. |
|
| Viscoelastic Friction Factor Report | Download Report | Help Page | Shows calculated Indentation factor, material and belt flexure, idler drag and idler skew and tilt losses when the Viscoelastic calculation method is used. | |
| Resonance Report | Download Report | Help Page | Shows the calculated Idler Roll frequency and Belt Transverse Wave frequency for each section of conveyor and the mode indicating whether or not belt resonance may be present in the section. See video in the Help file link on left. | |
| Belt Tensions | Tension Summary Run/Start | Download Report | Help Page | Belt Tensions at each point along the conveyor under different loading conditions Running and Starting. |
| Tension Summary Belt Sag | Download Report | Help Page | Belt Tensions and % sag at each section along the conveyor under different loading conditions Running, starting, braking and coasting. The user can specify the idler spacing in the Sections Table in the inputs. | |
| Run Fully Loaded Tensions | Download Report | Help Page | Tension breakdown and includes tensions: T1 Run, T2 Run, Tp Pulley, Te Drive, Tension Adjustment (manual adjustment), Material Acceleration, skirt and scraper Friction, Effective tension for the section. Also includes the calculated friction factor f for each section and the total belt power and take up movement. | |
| Tension Graphs | Download Report | Help Page | Tensions in Graph format. | |
| Starting Stopping / Curves | Starting and Stopping Report | Download Report | Help Page | Starting and stopping times and discharge volumes under the different loading scenarios. Also shows the conveyor system masses. |
| Vertical Curves Report | Download Report | Help Page |
Shows at each point if there is a Concave or vertical curve, the user inputted curve radius
and the belt tensions at these points.
Concave curves: Calculates and shows the minimum curve radius required to limit belt lift off. Convex curves: The center and edge tension of the belt is calculated and then the Minimum radius required to limit excess edge tension and the minimum curve radius required to prevent centre buckling in the belt are calculated and shown. |
|
| Horizontal Curves Report | Download Report | Help Page | Shows the calculated belt drift under different loading and running conditions in a horizontal curve. Includes easy to understand graphs to enable the user to optimize the super-elevation (banking) angle and curve radius. | |
| Equipment | Takeup Travel Report | Download Report | Input Help Page | Takeup Inputs and calculated values such as thermal expansion distance and permanent Belt stretch. |
| Idler Details | Download Report | Help Page | Shows the calculated Belt Deviation Load, the total load on the centre roll, bearing L10h life and the Idler Shaft Deflection at Bearing. | |
| Drive Details | Download Report | Help Page | Summary of each Drive. Selected and Required Gearbox Ratio shown with Selected and Actual Belt Speed. Calculated Pulley speed and drive factors. | |
| Motor Report | Download Report | Help Page | Shows the motor inputs and Absorbed power at pulley and at each motor. | |
| Fluid Coupling Report | Download Report | Help Page | Fluid Coupling Details | |
| GearBox Report | Download Report | Help Page | Shows the input data and the service factor, and the calculated required gearbox ratio to achieve the specified belt speed. | |
| Brake Report | Download Report | Help Page | This shows the selected brake and the calculated brake temperature. | |
| Shaft Coupling Report | Download Report | Help Page | This shows the selected high speed and low speed shaft couplings details. | |
| Pulleys | Pulley Reports |
Pulley Report
Pulley Dims Report Pulley Shaft Report Pulley Data Report |
Help Page | Four Reports showing the input details of the pulleys and also the calculated pulley speed, moment of inertia, Shaft Deflection dia Ddef in mm, Shaft Calculated Stress dia Dt in mm, recommended pulley shell thickness. |
Copy and Paste Raw Data into Spreadsheets
Generate Summary .csv files comparing multiple conveyors. Download an example here: Comparison Report .csv
Refine
Review the reports and graphs and go back to the model, make changes and recalculate to optimize. The Help file has details about how to read and interpret the reports.
For analysis of existing conveyors the user can calibrate the DeltaT conveyor model to ensure it closely represents the actual installed conveyor.
The DeltaT conveyor models can be copied and different configurations and scenarios can be made and compared. The individual conveyor models can be opened simultaneously in multiple tabs in your browser.
Dynamic Analysis
Helix recommends that for long or large conveyors with high installed power a Dynamic Analysis calculation is performed.
Dynamic Analysis calculates the transient belt Tensions and Velocities during starting and stopping of a conveyor under different loading conditions.
The Dynamic Analysis results provide a more accurate representation of the actual peak belt Tensions in the system during starting and stopping – Dynamic Tensions are often 20% higher than the belt tensions obtained using Static Analysis only.
After the Dynamic Calculations have been performed, the user can view and Print two dimensional and surface plot three dimensional graphs for Belt Tensions, Belt Velocities and Take up movement versus time step for all points along the conveyor.
Read more here :Dynamic Analysis
Download Demo02 Starting Loaded Report
Download Demo02 Stopping Loaded Report
General Calculations
Perform General Calculations (Quick Calculations) including Hopper Pull out force, Feeder load force, Discharge trajectory, Transition Distance and many more calculations. Jump to General Calculations
Sharing & Collaboration
This program is a user based subscription so it is important to be able to share conveyor files between users. There are two methods of file sharing:
Group Sharing
Ideal for companies with multiple users. Each user gets put into a User Group and then the users can add their conveyor files to that user Group. All the users in the group can view and copy the conveyor files.
Email Sharing
When in a conveyor file, add the emails of the users who you would like to share with. You can share with multiple users and give them view, view and copy or full edit permissions. You can also change ownership of the conveyor file and give it to another user.
Read more at Share a Conveyor File.
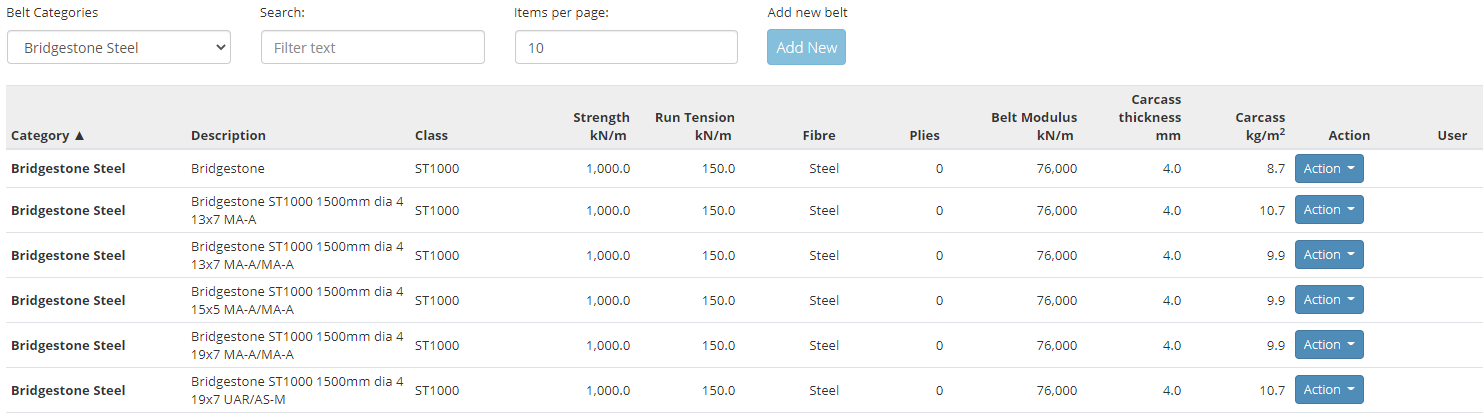
Equipment Databases
Register and login to view the extensive equipment databases managed by Helix Technologies. You can use our database to reference our data or store your own equipment data and pull it into the conveyor design file when you need it.
Equipment manufacturers can contact us and request to put your equipment in our database for users to select from.